Lumion 2025: Et viktig løft for visualisering i arkitektur og bygg
Lumion 2025 gjør arkitektteam i stand til å jobbe mer effektivt, samarbeide bedre og skape visualiseringer som virkelig engasjerer.


Corner (Nodal) Results
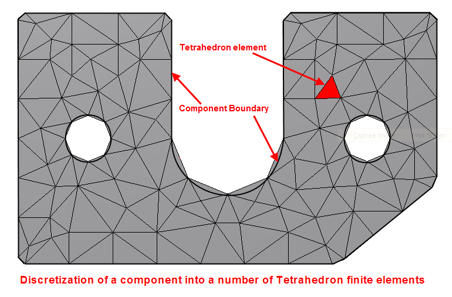
Nastran In-CAD provides the ability to display stress results using either corner or centroidal results. It is important to note this does not apply to displacement results. In this article we will concentrate on corner stress plots with average being the default stress plot. Stress Analysis by its very nature provides an approximation of the real-world problem by breaking it down into finite elements as shown below

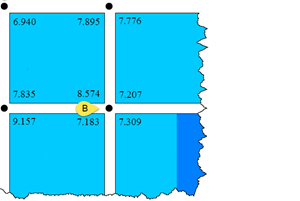
At each element corner (junction) there is more than result from adjoining elements as illustrated below @ node B. Within Nastran In-CAD you can select whether you want to see the maximum value from all the adjoining elements or the average of all the values at the node.
So, if we look @ Node B we can have any of the following values displayed
 Maximum option 8.574
Minimum option 7.183
Average option (8.574+7.207+7.183+7.309)/4 = 7.568
In an ideal world to obtain convergence in results, in addition to running analyses 3 times, we should expect the difference between minimum and maximum results to also be within 10% in the area of interest. The reason I mention area of interest is that there may be scenarios when the location of the maximum or minimum value may not be in the same location most likely due to stress singularities. The difference between maximum and minimum results will reduce as the mesh size gets smaller and smaller.
I hope you find this article useful, in my next blog I will talk about centroidal results.
NB: If you cannot wait and would like to learn more about Nastran In-CAD now then I would recommend the 'Up and Running with Autodesk Nastran In-CAD 2019' book available from Amazon worldwide.
If you would to watch some of the videos I have created around Autodesk Simulation then please take a look at our Simulation webinar library.
Lumion 2025 gjør arkitektteam i stand til å jobbe mer effektivt, samarbeide bedre og skape visualiseringer som virkelig engasjerer.
Lumion Cloud kan forbedre visualiseringsarbeidsflyten din og forenkle samarbeidet.
Forenkle samarbeidet i skyen med ACC, Autodesk Build og Naviate Correspondence – automatiser navngiving, koble tegninger og få øyeblikkelig tilgang til prosjektdata.
